Performance Monitors, Alerts, SQL Capture and
Automation

Historical Performance Data Analysis
Sentinel server provides a comprehensive monitoring, alerting and automation solution for your entire
IDS infrastructure. Sentinel server
runs as Windows service or UNIX/LINUX background process and provides 24x7
monitoring of multiple remote IDS instances. Collected time-series performance
data is stored in a built-in historical SQL repository. User-defined
alerts are triggered by Sentinel and logged in a historical
repository as well. Sentinel can execute user-defined jobs as responses to alert events
or on a scheduled time. Server Studio JE serves as a client application to
Sentinel providing powerful GUI to define monitors, alerts, jobs and
analyze collected performance data and generated alerts using graphical and
query tools.
Here are some major features of the Sentinel performance monitoring solution:
| Real-Time Monitoring |
You can define custom real-time monitors on ~100 IDS performance
parameters on server, table/index, space, chunk and user session levels.
Multiple IDS instances can be monitored and managed from a single
centralized console. Monitored performance data can be graphed in
real-time or you can use historical graph tool to view data collected in
the repository. |
| Alerts |
You can define multi-level alerts on any monitored parameter. Alert
notifications can be sent via email, pager or cell phone. A user-defined
job can be triggered to automate response to an alert event. User-defined
job can be OS Command, OS script, SQL script or stored procedure.
Centralized Alert Event Viewer allows you to see all alerts triggered on
all monitored instances as well as a status of associated job executions
and email notifications. |
| SQL Capture |
You can define SQL Capture processes to retrieve SQL statements executed
by user sessions. Collected data includes SQL statement itself, user
session information and statement's execution statistics, such as
estimated cost, number of temporary tables involved, etc. You can set
flexible custom filters to fine tune which SQL statements should be
captured. All captured SQL in stored in historical database for a future
analysis using provided SQL Viewer tool. You can also monitor captured SQL
statements in real-time. |
| Time-Series IDS Performance Data Analysis |
The built-in historical performance repository allows you to store
unlimited collected performance and SQL data. Provided graphical and query
analytical tools allow you to perform time-series correlation analysis on
collected multiple performance parameters. You can also build daily,
monthly and hourly histograms to identify high load periods. Data can be
easily exported to a text file for analysis in any other analytical
program, such as MS Excel. |
| Automation |
You can define custom jobs, which can be any OS command, script or SQL
script, execute them from a console, schedule job execution using a
flexible scheduler and assign jobs as a response actions to alert events
generated by real-time monitors. |
Server Administrator

Server Administrator - DB Space View
The Server Administrator add-on module provides the following features:
| Data Storage Explorer |
You can explorer and watch detailed information for DB Spaces, Blob
Spaces, Temp Spaces and Chunks. It shows percentage of filled and free
spaces, allocation of data for tablespaces and other data storage related information. You
can also create and delete DB Spaces, BLOB Spaces and chunks. |
| Table Reorganization Wizard |
You can reorganize table structure and data allocation to reduce number
of table extents, compress wasted space in table extents, move data to a
different dbspace or fragment between multiple dbspaces. |
| Table Extent Size Calculator |
The Table Extent Size Calculator helps you estimating a table's data size based on provided estimated number of rows and recommends optimal values for table
EXTENT and NEXT EXTENT parameters. Table extent sizes affect SQL query performance and amount of disk space consumed by the table. The calculator takes into consideration data pages as well as attached index pages and small blob data located in the table's
tablespace. |
| User Sessions Explorer |
You can explorer connected user session information, including last
executed SQL statement, locks, placed by the session, session I/O
statistics, and other parameters. The list of user sessions can be
sorted by a database, host computer, max number of locks and I/O
activity to bring attention to sessions, which create server
bottlenecks. SQL statements can be captured for performance tuning in the
Execution Plan Analyzer. You can also kill user sessions. |
| Table Data Explorer |
You can see individual table data size, db space allocations, allocation
of data between extents, and locks currently placed on the table by other
users. |
| Update Statistics |
You can run UPDATE STATISTICS statement for entire database, selected
group of objects and individual objects. All UPDATE STATISTICS
options are supported. |
| Reports |
You can run a variety of pre-defined reports designed to monitor a
server performance, efficient data allocation, and to highlight problems
with locks and user sessions. Each report allows you to specify a specific
filter and sort criteria. Reports results can be printed or saved in a
text file. |
| Server Properties Explorer |
You can view the server ONCONFIG parameters, server profile and I/O
statistics, and logical file details. |
| Change Server Mode |
You can change server mode by switching it to ONLINE, OFFLINE or QUIESCENT. |
| Run On-Utilities |
You can execute any On-Utilities, such as ONSTAT, ONMODE, ONTAPE, ONBAR,
as well as any server-side script or shell command using integrated telnet
terminal panels. These console panels automatically connect to the
selected server host and set all required Informix environment variables
to speed up the process of configuring your console environment. |
Advanced SQL Editor

Advanced SQL Editor
The Advanced SQL Editor add-on module provides the following features:
| LOAD and UNLOAD statements support |
LOAD and UNLOAD statements provide data import and data export
functionality from SQL scripts. |
| Query Execution Plan Analyzer |
Integrated Query Execution Plan Analyzer allows you to get output of
EXPLAIN PLAN for all statements in the SQL script. It helps you to tune
performance of your SQL queries by analyzing, which indexes are used by
Informix query optimizer. |
| Printing Support |
The contents of any SQL Editor, SQL syntax viewer within the
Server Studio and query result sets can be printed. |
| SQL Templates |
You can use predefined Informix SQL and SPL syntax templates, when
writing scripts in the SQL Editor. All templates can be edited and
extended by the user to meet the specific organizational needs. |
| Color-Coding |
All SQL Editors and SQL syntax viewers within Server Studio are
color-coded for Informix specific SQL and SPL languages. |
| Extended Table Object Explorer |
Extended Table Object Explorer allows to explore table's and view's properties,
such as columns, indexes and triggers, under the table/view node in the
Object Explorer tree. You can lookup and copy/paste table attributes
into SQL Editor while writing SQL statements or tuning SQL queries
performance without having to switch to another document. |
| Image Viewer |
Built-in Image Viewer allows you to view images stored in BLOB/BYTE
table columns and image files. |
| Query Execution Time Display |
You can see execution and fetch time for each query executed from the
editor panel. |
DB Difference Analyzer
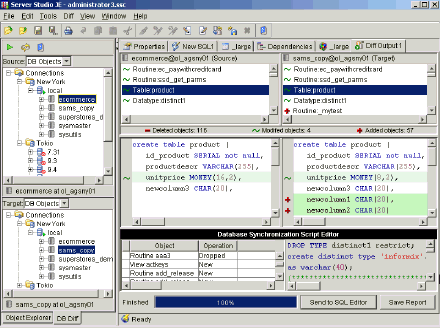
DB Difference Analyzer - Database Comparison Output
The DB Difference Analyzer add-on module provides the following features:
| Compare Databases |
Diff Analyzer allows you comparing entire databases on the same
or different servers. It compares all db object properties including
table structure, referential integrity, fragmentation, and stored
procedure's, trigger's and view's syntax. You can also compare
individual database objects and groups of objects. Comparison
results can be saved in a text report file.
|
| Generate Database Synchronization Script |
Diff Analyzer allows you to generate database synchronization script
based on results of visual comparison. You can specify, which objects to
include in synchronization script, and which database has to be modified
to synch it with another one. Once the synchronization script is
generated, you can use an easy viewer that helps you to navigate to
selected object code in the script. The viewer also warns about
operation in script that might lead to potential data loss if the
generated script is executed.
|
| Compare ONCONFIG parameters between two servers. |
You can compare ONCONFIG parameters between two servers. For
example, it is very helpful if you want to find the reason of the
performance difference between development and production environment.
|
| Compare Text Files |
Diff Analyzer allows you comparing any text files including SQL
script files, data files, and so forth. You can also compare a
stored procedure script with a stored procedure installed in a
database.
|
Benchmark Runner
Benchmark Runner allows you to create custom load test scenarios that simulate behavior of your database
applications. Scenarios are executed from hundreds of virtual user sessions and client-side response time
is automatically measured and displayed. You can also use SSJE
Monitors to measure impact of these scenarios on the database server resources and overall performance.
Another way to use Benchmark Runner is for analyzing performance of your database applications before and after you change
a database server's configuration settings. For example, after some changes in the server configuration, the performance of OLTP applications can improve but performance of the decision support applications can decrease. Benchmark Runner scenario allows you to create a consistent performance benchmark test for all kind of transactions and run this test after each configuration change to see
an impact on different classes of applications.
Dependencies Analyzer
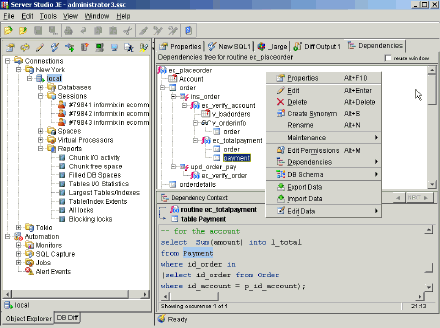
Dependencies Analyzer
The Dependencies Analyzer helps you to analyze dependencies between
database objects, including referential integrity constraints, call tree
dependencies for stored procedures and triggers, and 'up' and 'down'
dependencies for any object types.
The Dependencies Analyzer also provides powerful database search
function, which allows searching for any object usage pattern within single
or multiple databases or any text string within stored database object syntax.
The dependencies analysis can be invoked on demand or when you attempt to
drop a database object or a single table column to see immediate impact of that
operation on your entire back-end system integrity.
Results of DB search or dependencies analysis are presented in the form of
convenient dependencies trees with a drill-down capabilities, which allows to
see not only the list of dependent objects but also examine the exact object
usage context and SQL syntax. Dependencies reports can be viewed on the
screen, saved in the file and printed.
If required, you can immediately navigate to the corresponding object editor
to modify or remove the selected object dependency.
Data Manager

Data Manager with the Cell Editor window
The Data Manager add-on module provides the following features:
|
View and Edit Data
|
You can open data viewers and editors for database tables, synonyms
and views. Data is presented within a scrollable and resizable grid
similar to a spreadsheet. You can apply back-end filters and sorts as well
as limit number of rows to retrieve for editing. |
|
Data Import Wizard
|
Data Import Wizard allows you visually create and
execute data import jobs. It provides ability to include multiple
import files for a single import job. For each file and database table you
can use file preview mode, map file and database table columns and specify
a number of other data import options. Data import operation does not
block the rest of the application when executing. Data loading
process can be monitored and interrupted by the user at any time. Multiple
data import jobs can be started simultaneously against the same or
different database servers.
|
| Data Export Wizard
|
Data Export Wizard allows you visually create and execute data export
jobs. Data can be exported based on a single database object, such as
table, view or synonym or based on any SQL query. The number of options
can be specified, such as ability to log all errors into the file, field
delimiter or if to export column headers to a file. Multiple database
objects can be exported within a single export job. Multiple export jobs
against the same or different database servers can be launched
simultaneously.
|
| Test Data Generator |
Test Data Generator allows you to create large data sets to test your
SQL queries performance and back-end application logic. It supports a
number of value generation methods, including random data generation,
generation based on a text file or another database objects. It
automatically takes care of referential integrity constraints, unique
indexes and other dependencies, which usually makes creation of test data
difficult and cumbersome process. The number of generation options are
supported, such as ability to specify data ranges, text data patterns,
sequential data generation, BLOB and CLOB data generation, and more. |
| Cell Editor |
Cell Editor window allows you visually edit large text data, which do
not fit a grid cell, and import or export binary data and images into
a table columns. It also enables editing of complex data, such as ROW
TYPES and LISTS using hierarchical tree view. |
Permission Manager
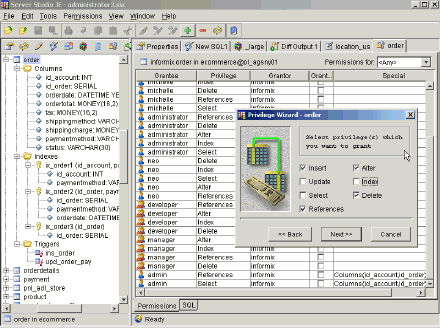
Permission Manager
The Permission Manager add-on module provides the following features:
| Users Explorer
|
Users Explorer is added to the basic Object Explorer. You can add new
users to a database or modify the existing user permissions. You can also
assign users to a role and grant database objects permissions to a
user. |
| Roles Explorer |
You can view existing roles and create new roles. You can assign users
to a role and define object permissions to a role. |
| Database Object Permissions |
For each database object, such as a table or stored procedure, you can
view list of existing user permissions and grant/revoke permissions to a
single or multiple users and roles. All parameters of GRANT and REVOKE
statements are supported in the visual permission editor. |
| Recovery of existing object permissions |
Editing an existing database object, such as stored procedure or view,
requires dropping an object and re-creating it afterwards. This operation
loses the existing object permissions and they have to be recovered after
each object modification. Permission Manager solves of this problem
by applying all previous object permissions to an object after if is
modified in the SQL Editor. |
DB Schema Manager
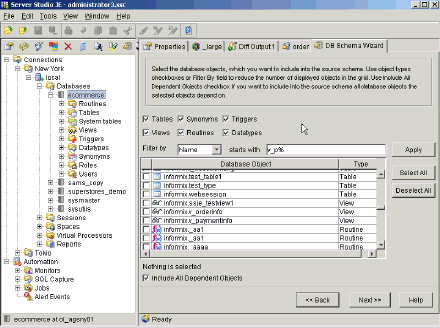
Schema Manager
The DB Schema Manager add-on module provides the following features:
| Export DB Schema
|
You can export DDL for entire database schema, selected types of
database objects, or selected group of individual objects to SQL
script file. For example, you can select 3 stored procedures, 2 tables and
choose an option to automatically include in SQL script all other objects
the selected procedures and tables depend on. |
| Copy/Deploy Database Schema |
You can directly deploy a selected schema or sub-schema to another
database or database server. For example, you can copy some application
related stored procedures and tables from production server to a
development server for debugging. |
| Print DB Schema |
You can print entire database schema or just a selected part of the
schema as catalog objects list or DDL script. You can specify a number of
options for DDL generation. |
| Map DB Spaces |
While exporting the selected schema or copying the schema to another
server, you can specify how to map DB spaces and BLOB spaces from source
server to a target server. |
Stored Procedure Debugger
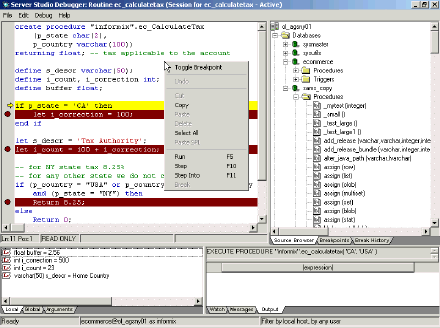
Stored Procedure Debugger - Active Debugging Session
SPL Debugger is the only interactive debugger for Informix database servers'
stored procedures and triggers available on the market and contains powerful
capabilities usually found only in high level programming languages. It enables
you to execute stored procedures and triggers line-by-line, to step into nested procedures or fired triggers,
to set breakpoints, to watch and to modify values of procedures' variables and calling arguments, break infinite loops,
etc.
SPL Debugger can be invoked from any client application or development tool,
such as Visual Basic, PowerBuilder, C++, Informix-4GL, etc. Remote debugging gives you ability to
execute calling application from one workstation on the network, while SPL
Debugger runs on another. Simultaneous debugging sessions can be initiated from any workstation on the network.
Another important feature of SPL
Debugger is it's ability to "hook" into stored procedure or trigger that is already
executing on the server, enabling you to identify the cause of infinite loop or
to pinpoint the slowest portion of the code.
SPL Debugger supports watching and editing all types of variables including UDT,
OPAQUE and COLLECTION datatypes.
NOTE
SSJE SPL Debugger Add-On Module is available only when Server
Studio JE is installed under Windows platforms.
SPL Debugger does not support databases created in ANSI mode.
It works only with native Informix databases.
XPS 8.3 Connectivity Support
The XPS 8.3 Connectivity Support add-on module allows the basic tools, such
as Database Object Explorer, Table Editor and SQL Editor, to work against XPS
8.3 database servers.
Online 5.10 Connectivity Support
The Online 5.10 Connectivity Support add-on module allows the basic tools,
such as Database Object Explorer, Table Editor and SQL Editor, to work against
Online 5.10 database servers.
SSJE Enterprise Edition
The SSJE Enterprise Edition bundle includes the following add-on modules:
SSJE Developer Pack
The SSJE Developer Pack bundle includes the following add-on modules:
|
|